Development / Environmental evidence
Carbon
Compass.
A wider view.
A closer understanding.
Environmental data becomes useful when people can understand what they are looking at. Carbon Compass brings emissions inventories, satellite observations and landscape context into a shared map—and keeps the distinctions between them visible.
App Development CollaboratorMarch 2025–Present · iPad & iPhone · In development
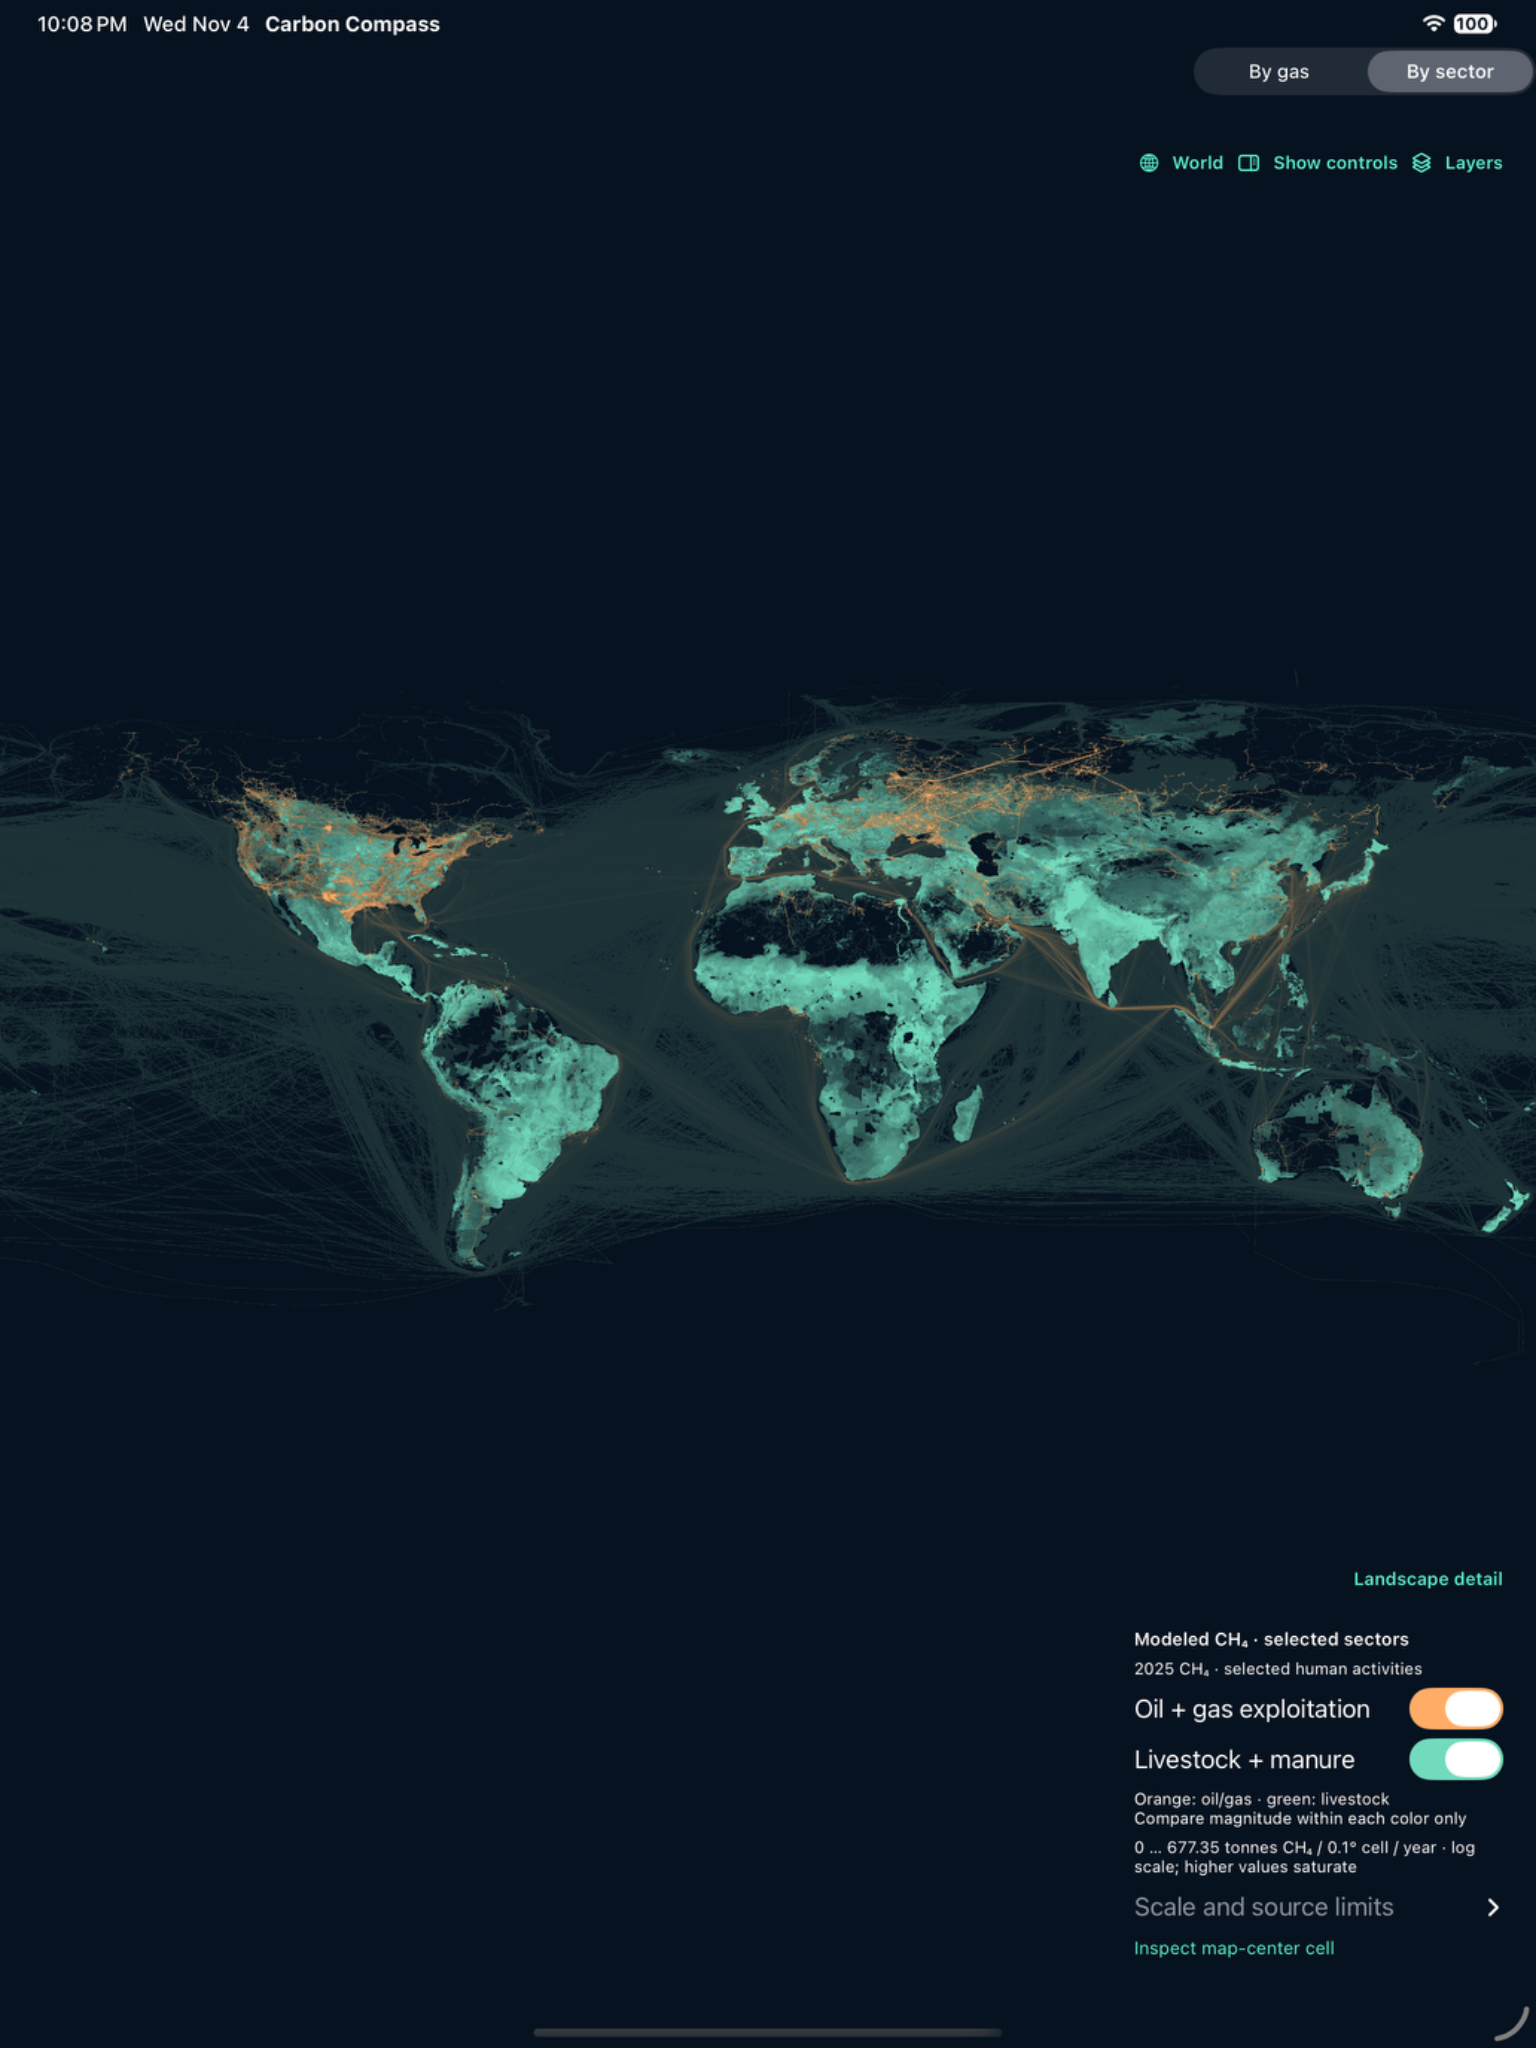
Original iPad simulator capture · development build 16 · November 2026.
01 / Product design
Clarity is
a design decision.
I help shape the experience of moving from the global picture to a particular place. My work connects visual design, map navigation and prototype review with the needs of an environmental investigation.
- Define interface priorities and clearer ways to choose scientific layers.
- Review transitions between global inventories, individual observations and landscape detail.
- Identify presentation gaps, including apparent plume-to-basemap misalignment and the need for context while zooming.
- Collaborate on facility information, power-sector exploration and future carbon-project mapping.
- Review updates on Apple devices and turn feedback into development priorities.
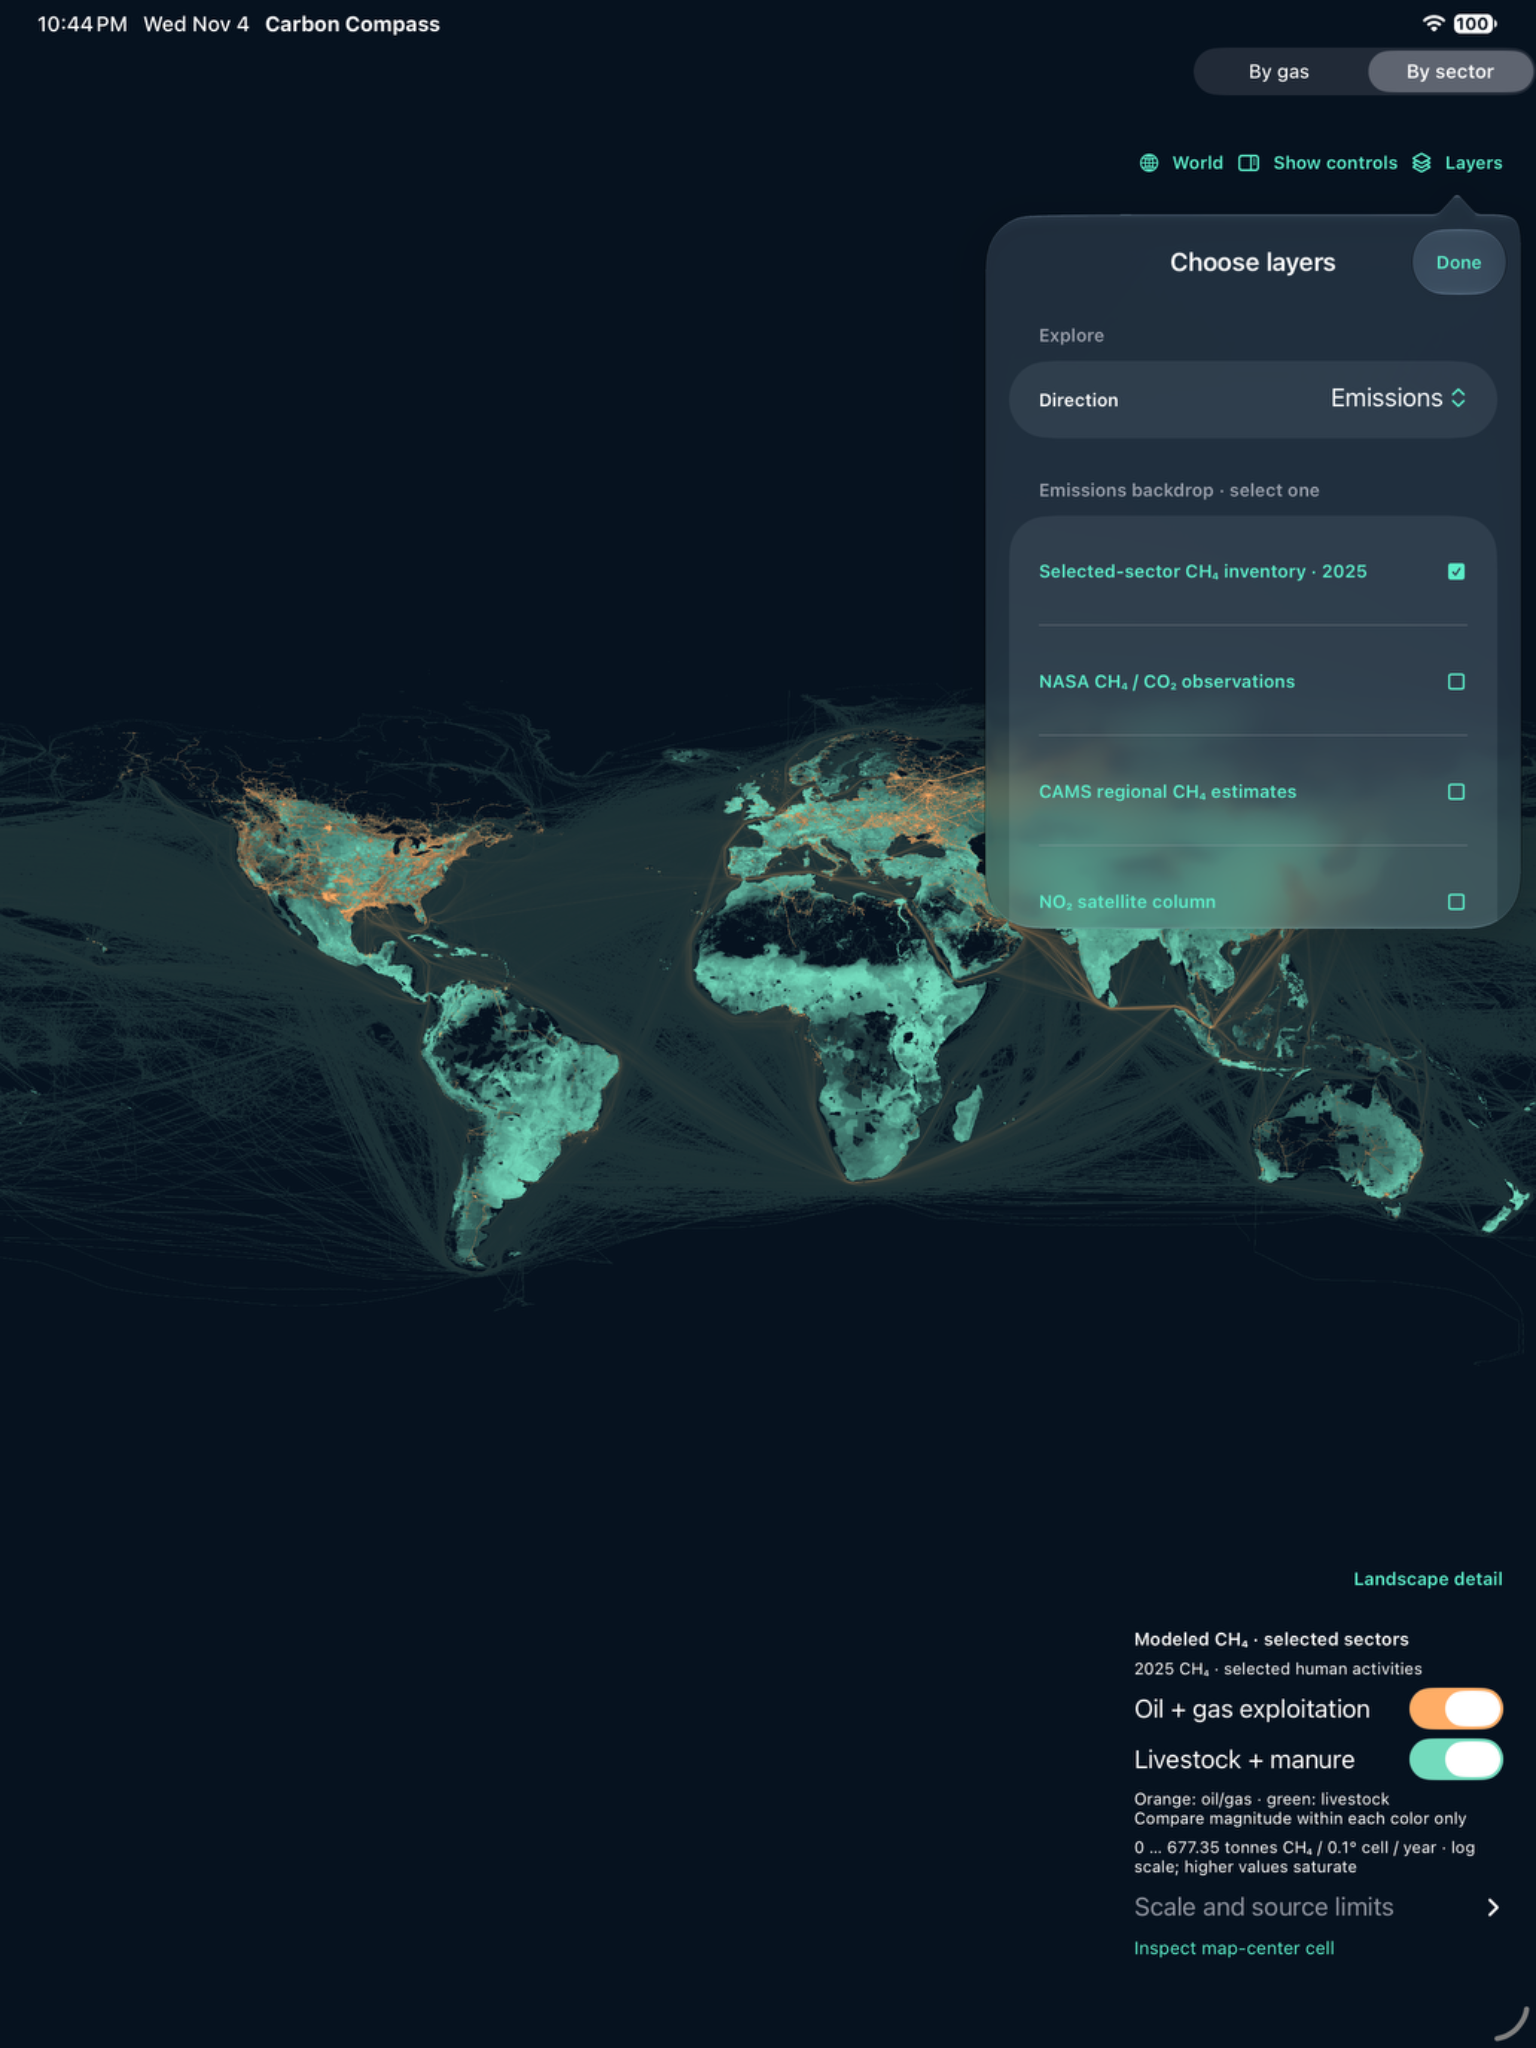
Original iPad simulator capture · development build 16.
02 / The interface
Keep the question
in view.
The map stays central. A persistent Layers control gives users a clear way to move between evidence types while holding their place in the landscape.
The global view shown here presents selected 2025 methane inventories for oil and gas exploitation, and livestock and manure. Each color has its own scale. The view provides modeled annual context; it does not depict live leaks or pipeline geometry.
My design interest is the passage between these scales: enough context to orient the user, enough detail to support careful review.
03 / Evidence in context
Look closer.
Keep the source.
The observation view brings NASA/JPL EMIT methane-enhancement imagery together with its footprint, acquisition time, scale and source. Opacity and focus controls help users inspect the scene without losing that context.
The original screen shows an observation acquired on August 26, 2022. Its ppm·m enhancement values are distinct from an emissions rate. The approximately 60-metre source pixels do not establish facility ownership or source responsibility.
That distinction matters to the product. A useful interface should make the evidence easier to inspect while preserving what it can—and cannot—support.
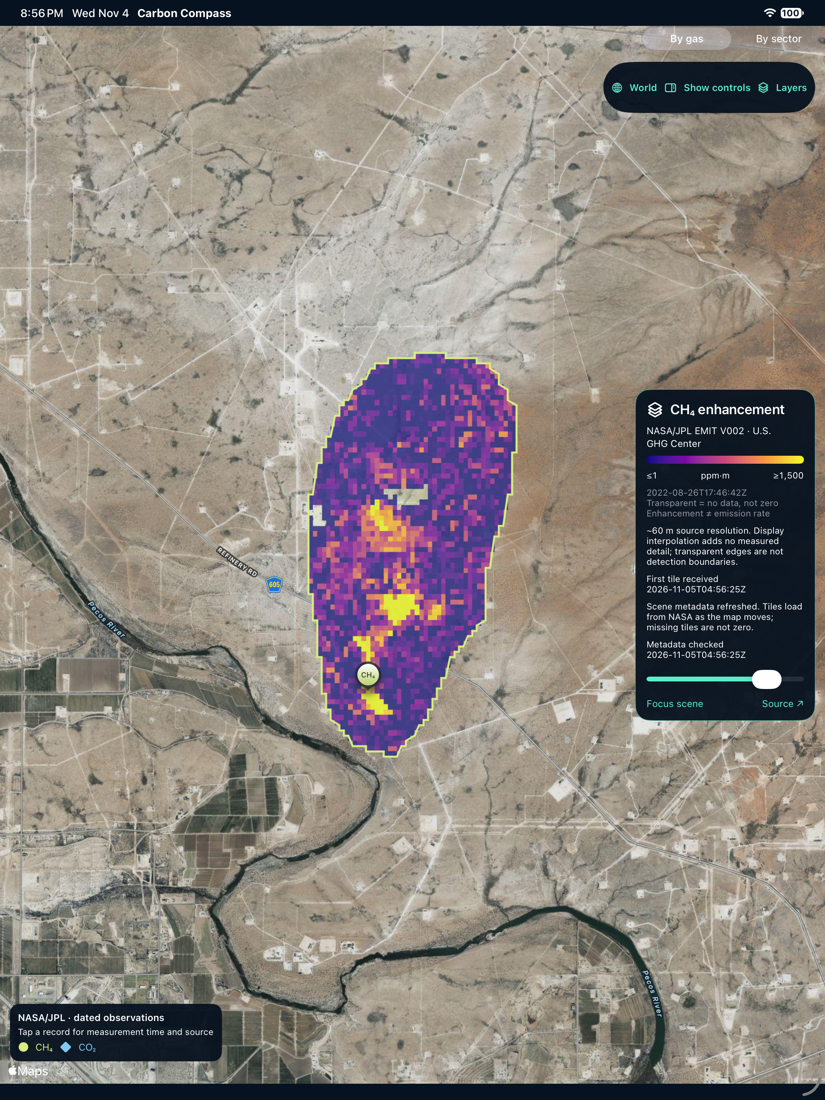
Original iPad simulator capture · development build 15.
04 / The next stage
From a map
to a considered investigation.
A working prototype.
The documented workflow brings together map exploration, observation records, facility context, local workspaces, notes and review exports. The screens on this page are genuine development captures, preserved in full.
Research still in progress.
Carbon-project mapping and sequestration research remain development directions. Validation, geographic alignment and integration continue. The prototype is not presented as a released commercial service or a carbon-credit verification system.